Temperature and Fuel Economy
#11
 04-03-2007, 12:33 PM


Pravus Prime- yep, the dotted and solid lines track pretty darn well. Some sort of relatively direct relationship between temperature and FE is indicated. I love data! Data is great. Thanks for sharing.
#12
04-04-2007, 07:06 PM

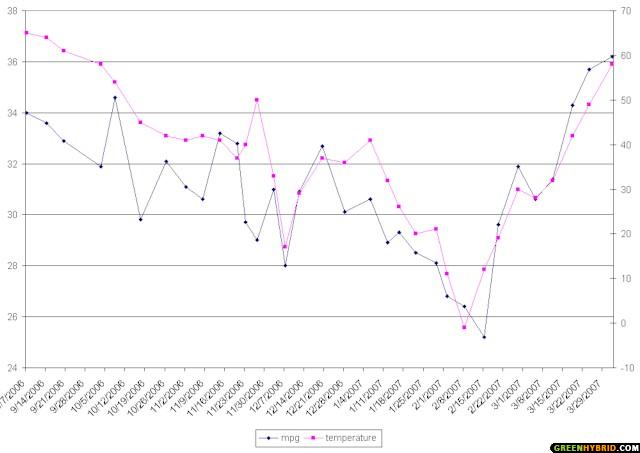
Okay I'm going to try and see if I can get an image in here successfully... if it shows up this is a chart of my FE vs. mean average temp per fillup over the life of the vehicle. It's amazing how closely the lines track each other.
#13
04-06-2007, 09:29 AM
Wow! One thing I notice about this (all the data so far) is that not only does temperature track FE really well, but as time goes on, it gets closer and closer to an exact match. There's definitely a break-in period, where either the car is responding to battery break-in, or the driver is getting used to driving a hybrid and perfecting the technique of getting the most out of the car. Once those techniques are learned or the battery has settled down, the only 'limiting' factor on your FE seems to be the temperature. It's really remarkable.
#14
04-06-2007, 11:17 PM

Brady,
Your Mileage vs temperature chart looks quite similar to mine. I also used mean ambient temperatures for each tank and I am also in the Chicago area so the temperature chart is the same.
My Highlander Hybrid takes a big hit with low temperatures. The temperature/MPG correlation is very strong.

Your Mileage vs temperature chart looks quite similar to mine. I also used mean ambient temperatures for each tank and I am also in the Chicago area so the temperature chart is the same.
My Highlander Hybrid takes a big hit with low temperatures. The temperature/MPG correlation is very strong.
#15
04-07-2007, 10:24 AM
That's great Don! Yours is a lot less erratic in the beginning than mine. As I was learning with the vehicle I was trying a lot of different techniques.
Do you use the weatherunderground almanac thing for your temperatures?
Do you use the weatherunderground almanac thing for your temperatures?
#16
04-29-2007, 07:26 AM

It is great to see the data that has been gathered here. The EPA study (www.epa.gov/otaq/rfgecon.htm) that was referenced suggested that about a 20% reduction in mpg is associated with the winter due to temperature, engine warmup, and gasoline mix . While my reported temperatures have been best guesses for the driving period for each tank refill, I see similar results across 82 tanks (39,000 miles) of gas over two years in my 2005 Honda Hybrid Civic. In terms of outside temperature - below 50 oF takes a heavy toll. Above 90 oF I start touching the air conditioning so I loose the highest mpg opportunities. The second graph shows the seasonal effect. I've encoded the dates over the 2 years in fractional months. The whole number is the month number and the fractional part is the day of the month. I multiply the day of the month by 0.0322 to make it a decimal fraction of a month: thus January 1 is "1.03" and December 31 is "12.998" Obviously the temperatures vary by date but the striking change between April (4) and May (5) suggests to me a gasoline mixture change. There is considerable variability in mpg associated with other factors such as rain, snow, high speed highway driving, and occasional driving by family members who have not perfected efficient driving skills.


#17
04-29-2007, 09:39 AM
Hi folks,
This is what mine looks like using excel trendlines to smooth the data:

It includes my 'learning curve' miles and picking up the car 800 miles away. Folks who started recording their data when the temperatures are increasing should use a 5th degree polynomial to keep the curves smooth.
Bob Wilson
This is what mine looks like using excel trendlines to smooth the data:
It includes my 'learning curve' miles and picking up the car 800 miles away. Folks who started recording their data when the temperatures are increasing should use a 5th degree polynomial to keep the curves smooth.
Bob Wilson
Last edited by bwilson4web; 04-29-2007 at 09:41 AM.
#18
04-30-2007, 04:57 PM

Looks like from the graphs above that you tend to get about 1 mpg FE for every 10F warmer day.....
So my Dodge Caravan could get 50mpg at about 365F
So my Dodge Caravan could get 50mpg at about 365F
#19
05-02-2007, 12:14 PM

I now have 2 years of pretty good data for my Ford Escape Hybrid that I bought in April of 2005. I maintain a log for all my vehicles I have owned. The hybrid has the AWD version. Driving conditions are maybe 50% highway, 50% non-highway. Total miles driven at this time is 23,000.
Average of MPG
Month MPG
1 27.56958549
2 25.43849162
3 27.86853047
4 29.21435715
5 30.41799845
6 29.28584328
7 29.90469162
8 31.55449697
9 32.77215671
10 30.76233456
11 29.09110949
12 26.26916832
If you overlay the MPG with average temperature there is a near identical fit. The weather is Colorado near Denver. I would be curious to know what San Diego data looks like then maybe Alaska.
#20
05-02-2007, 02:00 PM
That's great, but let's move this into the "Weather and FE" discussing thread, shall we?
Let's also rename the thread to make it easier for others to find.
Let's also rename the thread to make it easier for others to find.
Last edited by Pravus Prime; 05-02-2007 at 02:03 PM.