Civic Hybrid II graphs
#1
 12-14-2006, 03:30 PM

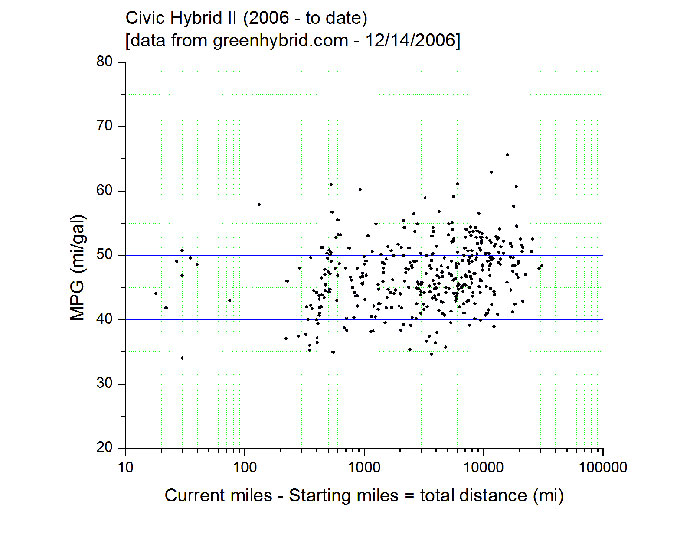
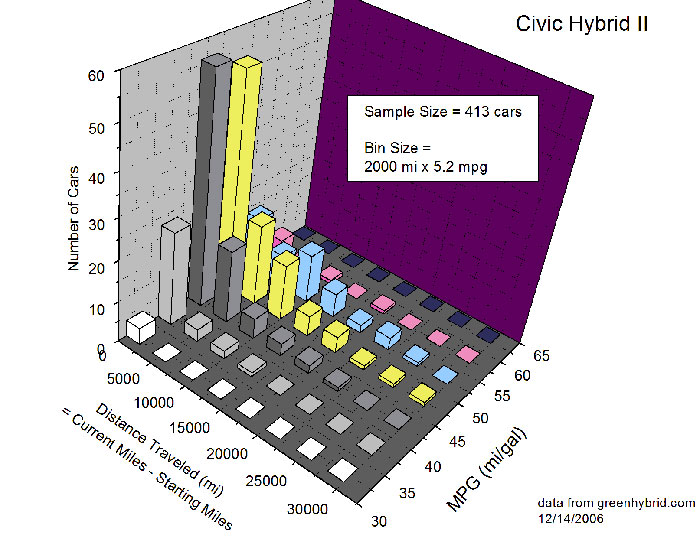
I've posted two pictures in the zip file attached to this thread. One is a graph of Civic Hybrid II users' mpg versus distance traveled (current - starting miles). The other is a 2D histogram of that data showing the frequency (in number of cars) of the mpg versus distance traveled data. The bin size was 2000 mi and 5.2 mi/gal (1 standard deviation in mpg, as of 12/14/2006, as given by greenhybrid.com data of the total sample of Civic Hybrid II cars.
The idea of these plots was to shed light on the mpg performance as a function of distance traveled. The 2D histogram is the same as the overall histogram as given on the Civic Hybrid II main page, but taking into consideration the extra dimensionality of distance traveled.
It appears as if the more distance the people drive their Civic Hybrid II cars, the mean distribution of mpg will shift up a few mpg. This statement is probably only good up to about 20000 miles.
Caveat: there is debate in other threads in this forum category over whether the difference in current - starting miles figures (what I call distance traveled) are accurate. Please see those threads concerning this matter.
#2
12-14-2006, 03:41 PM
�ber Lord of Hypermillia
Join Date: Aug 2006
Location: San Francisco Bay Area
Posts: 652

Thread
Topic Starter
Forum
Replies
Last Post
discoganya
Honda Civic Hybrid
2
11-12-2006 06:27 PM