Graph of Power verse MPH and sources
#1
 05-17-2009, 08:04 PM


Join Date: Nov 2006
Location: Southwestern Pa
Posts: 1,747
I found a powerpoint display with this 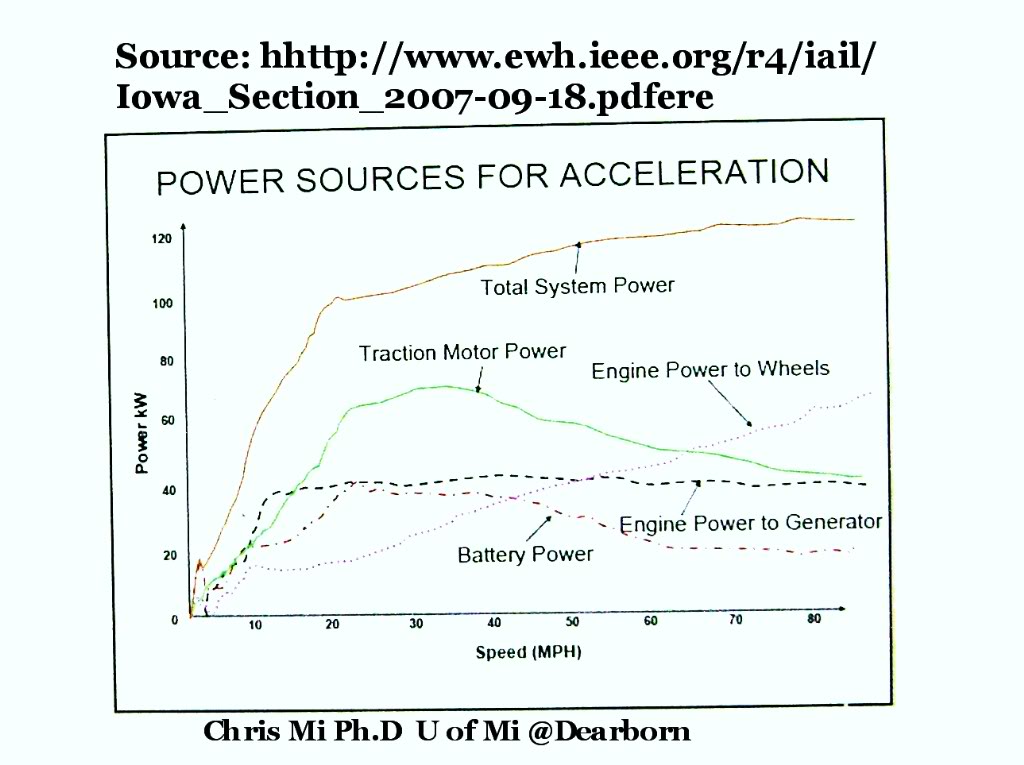 graph:
that might be useful for present and future discussions. Note this refers to the 1st generation Escape Hybrids 2005-2007.
graph:that might be useful for present and future discussions. Note this refers to the 1st generation Escape Hybrids 2005-2007.
#2
05-19-2009, 11:44 AM
This is interesting but I question how the battery could put out 40kW. Also, at 85MPH the ICE would have to be turning 6500RPM to put out 108kW based on an earlier slide. But those items notwithstanding, some other interesting things that can be gleaned from the chart:
Traction motor torque is constant up to about 2900 RPM and at max power of ~68kW it appears to be about 94-95% efficient. Generator power through the ICE is only about 70% efficient. At about 35MPH the ICE total power finally exceeds the traction motor power. Very surprising how little ICE power goes to the wheels and that it is well over 60MPH before the ICE power to the wheels is greater than the traction motor's. I assume of course that this is pedal to the metal acceleration. Given the ICE power numbers, it pretty much has to be.
Traction motor torque is constant up to about 2900 RPM and at max power of ~68kW it appears to be about 94-95% efficient. Generator power through the ICE is only about 70% efficient. At about 35MPH the ICE total power finally exceeds the traction motor power. Very surprising how little ICE power goes to the wheels and that it is well over 60MPH before the ICE power to the wheels is greater than the traction motor's. I assume of course that this is pedal to the metal acceleration. Given the ICE power numbers, it pretty much has to be.

Thread
Topic Starter
Forum
Replies
Last Post